I’ve been thinking quite a bit about replicated or “mirrored” triads in the Shield Chart and what they could possibly signify in certain readings, if anything at all. I’ve yet to come across anything in the geomantic literature that speaks directly to this occurrence, though it’s certainly possible that someone, at some point, has explored their divinatory relevance. My hunch is that mirrored triads are more than just an occasional mathematical phenomenon and perhaps reflect an attempt by the psyche to communicate something pertinent to the query.
In an effort to get a general idea of how often mirroring occurs, I recently analyzed 50 charts, thirty-five (70%) of which were cast by various members of an online geomancy study group that I frequent, and fifteen (30%) of which were cast by me.
Structural Models
In the process of conducting this analysis, I first realized that we typically only interpret five of the eight triads that actually make up the Shield Chart (i.e., the Court and Four Triplicities). Due to the possibility that relevant mirroring may occur in these three additional triads, all of the charts sampled were analyzed according to two models of the chart, henceforth referred to as the Standard Model (five triads) and Extended Model (eight triads). The following table lists the ordinal location and composition of the triads according to both models using geomantic shield notation:
| Triad | Standard | Extended |
|---|---|---|
| 1st Triad | M1 + M2 = N1 | M1 + M2 = N1 |
| 2nd Triad | M3 + M4 = N2 | M3 + M4 = N2 |
| 3rd Triad | D1 + D2 = N3 | D1 + D2 = N3 |
| 4th Triad | D3 + D4 = N4 | D3 + D4 = N4 |
| 5th Triad | RW + LW = JU | N1 + N2 = RW |
| 6th Triad | N3 + N4 = LW | |
| 7th Triad | RW + LW = JU | |
| 8th Triad | M1 + JU = SE |
Recurrence Types
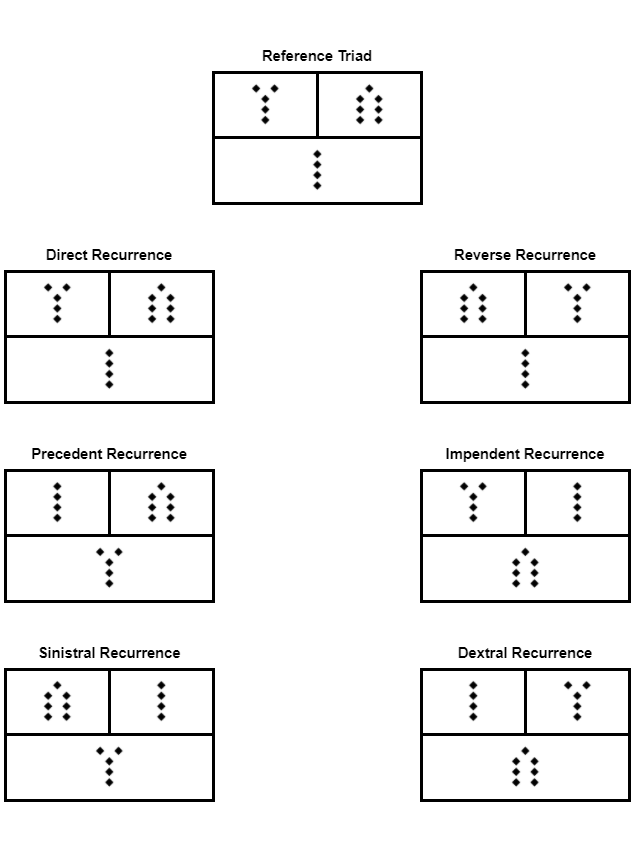
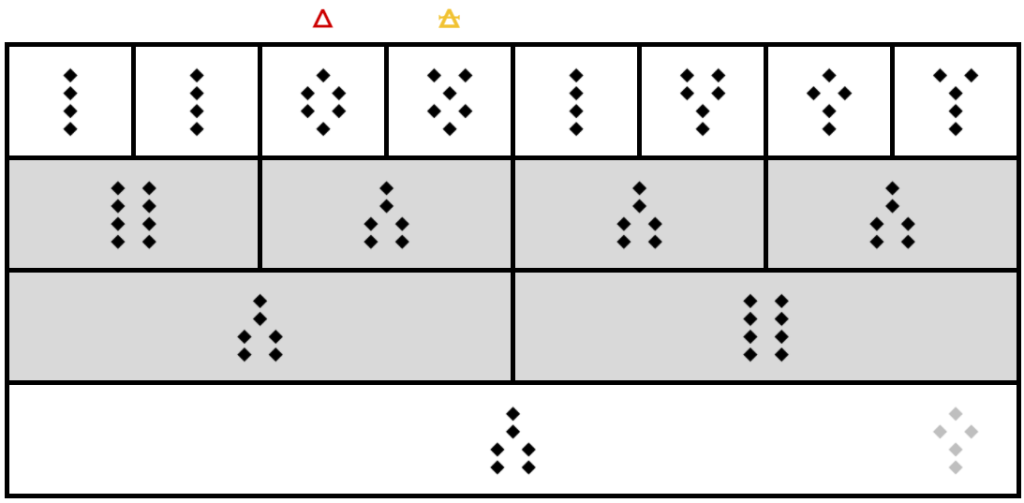
Early in my analysis, I also discovered that there are only six ways in which a triad can be mirrored by another, if we define “mirrored” as containing the same three figures regardless of their arrangement. To differentiate the common understanding of “mirrored” as mere replication from this broader definition, I’ve chosen to refer to this phenomenon as triadic recurrence. The table below illustrates the naming conventions that I’ve assigned to each of the six types and their rules, followed by a reference diagram and examples of each recurrence within a Shield Chart:
| Recurrence⠀ | Rule |
|---|---|
| Direct | When a triad is identical to a preceding one. |
| Reverse | When the Child in a triad is the same as the Child in a preceding one, but the Parents are switched. |
| Precedent | When the Right Parent in a triad is the same as the Right Parent in a preceding one, but the Left Parent and Child are switched. |
| Impendent | When the Left Parent in a triad is the same as the Left Parent in a preceding one, but the Right Parent and Child are switched. |
| Sinistral | When the figures in a triad appear in a preceding one but are rotated counterclockwise. |
| Dextral | When the figures in a triad appear in a preceding one but are rotated clockwise. |
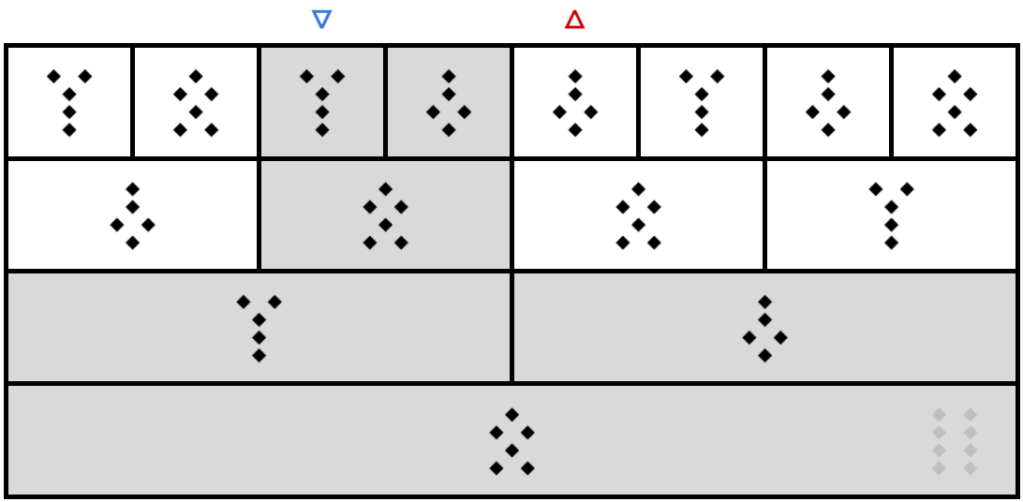
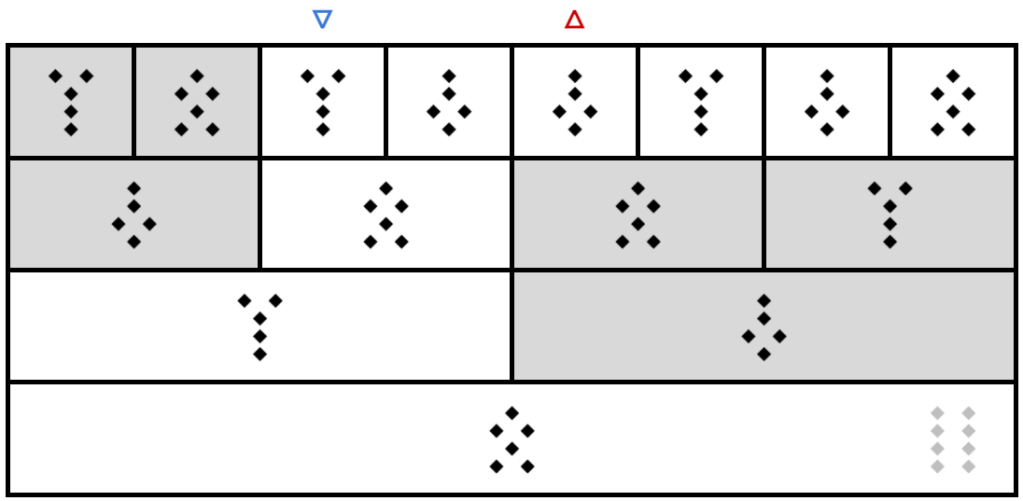
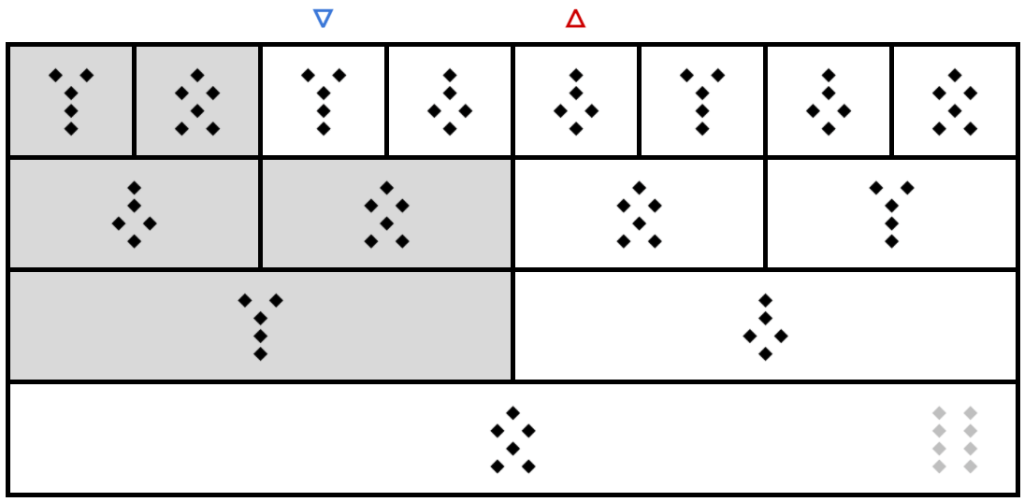
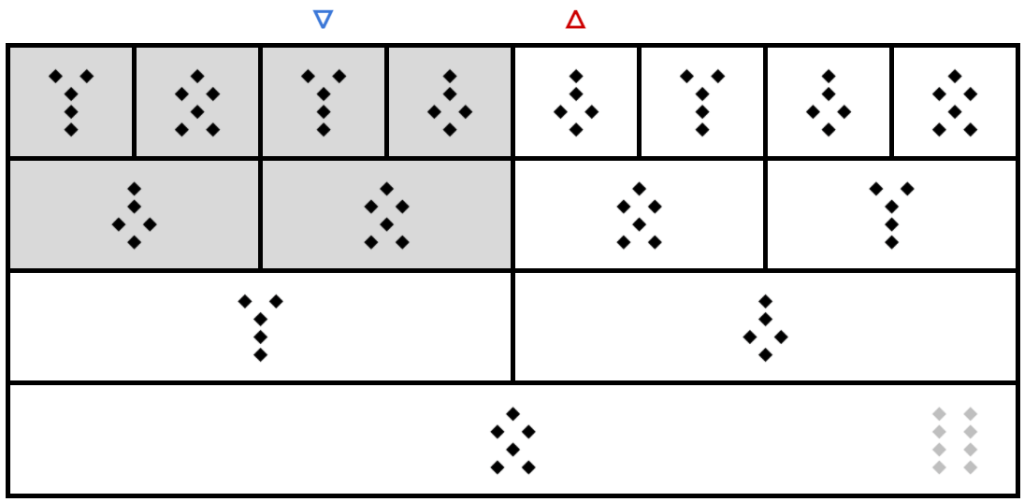
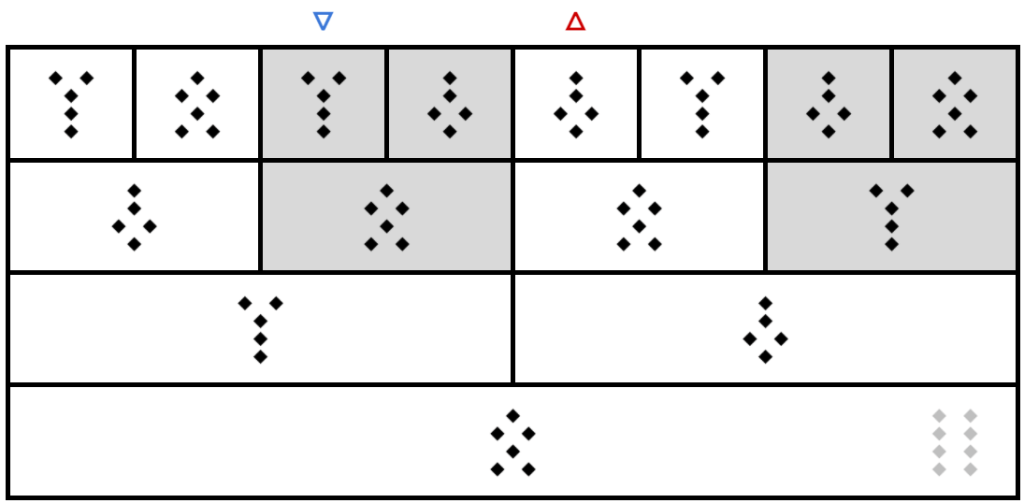

In addition to these six types, I discovered that multiple recurrences can occur at once if the triads contain two or more identical figures; I am referring to this phenomenon as Multiple Recurrence. For example, the 5th Triad in the chart below is both a Precedent and Sinistral Recurrence of the 6th Triad:
Recurrence Frequency
After identifying the two models with which to analyze the sample and establishing the rules for each type of recurrence, I was then able to ascertain the frequency of recurrences in the sample.
When analyzed with the Standard Model, 12 out of 50 charts (24%) contained recurrences, while 38 out of 50 charts (76%) did not. Additionally, 7 out of 50 charts (14%) contained only one recurrence, while 5 out of 50 charts (10%) contained more than one, totaling 25 recurrences. Data on the frequency of each type of recurrence for the Standard Model is reflected in the chart below:
STANDARD MODEL

When analyzed with the Extended Model, 32 out of 50 charts (64%) contained recurrences, while 18 out of 50 charts (36%) contained none. Additionally, 12 out of 50 charts (24%) contained only one recurrence, while 20 out of 50 charts (40%) contained more than one, totaling 115 recurrences. Data on the frequency of each type of recurrence for the Extended Model is reflected in the chart below:
EXTENDED MODEL
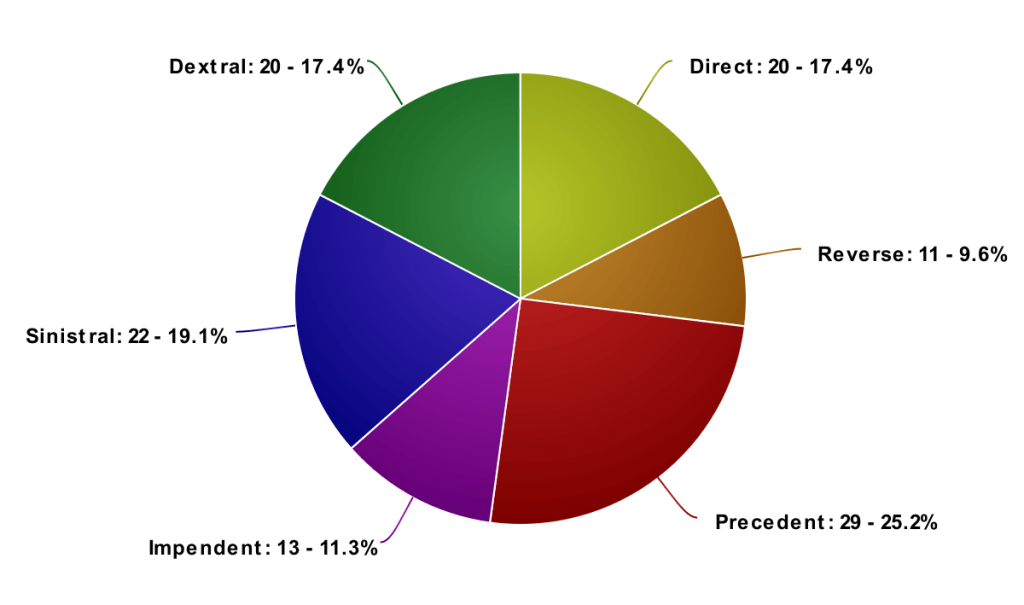
No Multiple Recurrences were found in the sample when analyzed with the Standard Model, while 11 Multiple Recurrences (34.4%) were identified when the charts were analyzed with the Extended Model.
Limitations and Further Development
While the analysis of the sample allowed me to identify the six types of recurrences and their frequency in both models, it did not provide much information as to their potential meaning within a given reading, largely due to the unverifiable accuracy of the interpretations provided for many of the charts within the sample. A more comprehensive analysis of triadic recurrences will be necessary to understand their relationship to outcomes and may require a substantially larger sample size, especially given the rarity of recurrences in the Standard Model. An additional limitation considered during this project is the possibility that the psyche/subconscious may have been employing triadic recurrences differently for each practitioner.
Despite these shortcomings, triadic recurrence could very well form the basis of a new interpretive technique to complement existing methods used to interpret the Shield Chart if distinct meanings can be assigned to each of the six types. One possibility is the development of a “triadic company” rule, whereby recurrences indicate that there is a meaningful link between two triads. The specific type of recurrence would further determine the nature of that relation, while the figures themselves could provide additional insight into the connection between the two.
For those interested in contributing to the ongoing study of this phenomenon, please feel free to comment or contact me with any findings and/or ideas that you may have.

Mathematics fascinate me, my dad was a mathematician. It is a bit beyond me but I love reading about it and am generally riveted. I am going to read this again more slowly.
LikeLiked by 2 people