A revised version of the following system can be reviewed at https://minorfracture.blog/2023/08/21/novenary-chart-revisions/
The practice of geomancy in the West has traditionally involved the interpretation of 16 symbolic figures in relation to the positions that they occupy on two types of charts, i.e., the Shield Chart and the astrological House Chart. While each of the figures carries a specific set of meanings, the charts’ positions also have assigned meanings in light of which the figures are interpreted. These positions form a pre-structured framework or pattern similar to “spreads” in tarot, as they serve to guide the reader’s interpretation of the figures and give context to their appearance. The entire art of geomancy is thus the process of intuiting the combined meanings of intersecting representations in relation to a query.
The Novenary Chart herein introduced is an experimental interpretive framework that relies on the mathematical relations between the figures and the intuition of the reader to determine the meanings of the chart’s positions. The ambiguity of this model is intended to allow the intuition some measure of freedom to structure and adapt the chart to the circumstances quesited or to the specific interrogative framing of the query (i.e., who, what, when, where, why, how, or yes/no). The following sections provide an overview of the Novenary Chart’s composition and function thus far.
Composition and Meanings
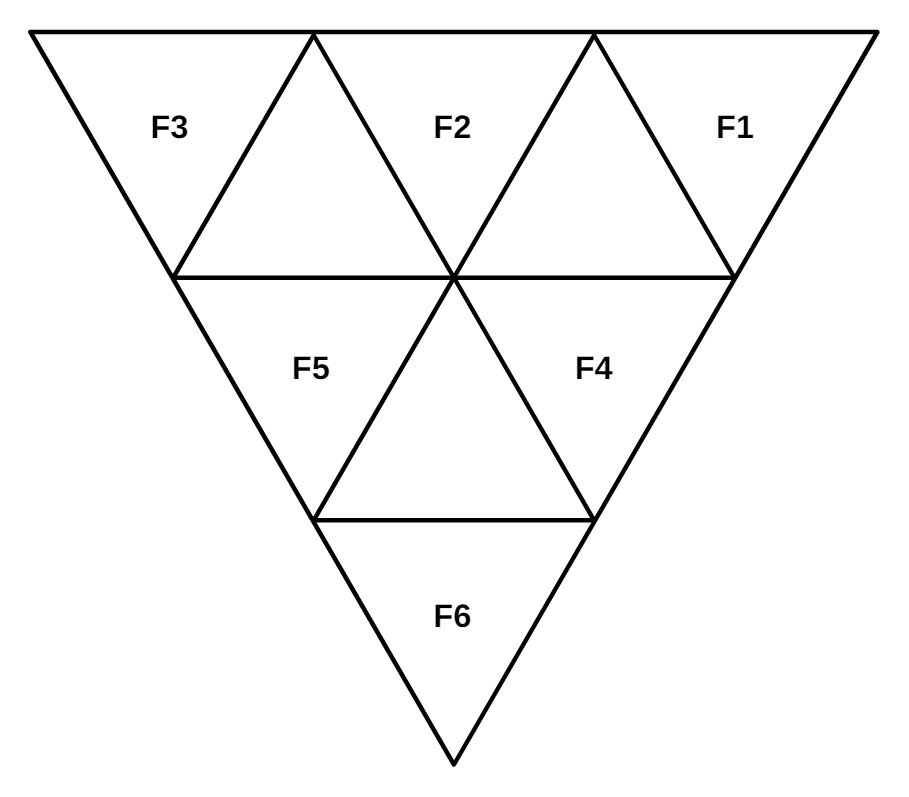
A Novenary Chart reading begins with the generation of three figures via the practitioner’s preferred method (e.g., 16 marked rows, dice, etc.). From these initial three, six additional figures are generated using the same method employed in the Shield Chart to produce the Four Nieces from the Mothers and Daughters. For ease of reference, the figures that will be displayed on the chart are numbered F1–F6 from right to left in descending order. The 7th, 8th, and 9th figures are not displayed on the chart, as will be explained in the table following the image below. All nine figures, along with their meanings and mathematical relations, are listed in the table below, though the order in which the figures are interpreted is to be determined by the reader.
| Figure⠀ | Name | Meaning |
| F1 | Right Condition⠀⠀ | The meaning of this figure in relation to F6 is to be determined by the intuition of the reader. |
| F2 | Fulcrum | This figure represents something that had, is having, or will have an influence on both F1 and F3 in the situation being analyzed. It can also represent something that F1 and F3 both share. |
| F3 | Left Condition | The meaning of this figure in relation to F6 is to be determined by the intuition of the reader. |
| F4 | Right Process | This figure is the mathematical sum of F2 + F1 and can represent the effect of F2’s influence on F1, or the outcome of their interaction. |
| F5 | Left Process | This figure is the mathematical sum of F2 + F3 and can represent the effect of F2’s influence on F3, or the outcome of their interaction. |
| F6 | Return | This figure is the mathematical sum of both F1 + F2 and F4 + F5. As it is the numeric distillation of all preceding figures, it represents the central answer to the query. |
| F7 F8 F9 | Ternion | These three figures are the mathematical sums of F1 + F5, F2 + F6, and F3 + F4, respectively. They will always match, and need not be displayed on the chart. While their collective symbolic meaning may be intuited by the reader, their repetition in the chart could suggest that they represent some underlying quality or overarching theme in the situation being analyzed. |
For ease of reference, the following naming conventions have also been assigned to the four main triads of the chart:
| Triad | Figures |
| Outer Triad | F1 + F3 = F6 |
| Right Triad | F1 + F2 = F4 |
| Left Triad | F2 + F3 = F5 |
| Lower Triad | F4 + F5 = F6 |
Lastly, there are several mathematical aspects of the Novenary Chart that might be useful for analytical or interpretive purposes:
| 4,096⠀⠀⠀ | Maximum possible number of different charts |
| 72 | Highest possible sum of all the points in the chart (inclusive of the Ternion) |
| 48 | Lowest possible sum of all the points in the chart (inclusive of the Ternion) |
| 60 | Median chart sum between 48 (lowest) and 72 (highest) |
Example Reading
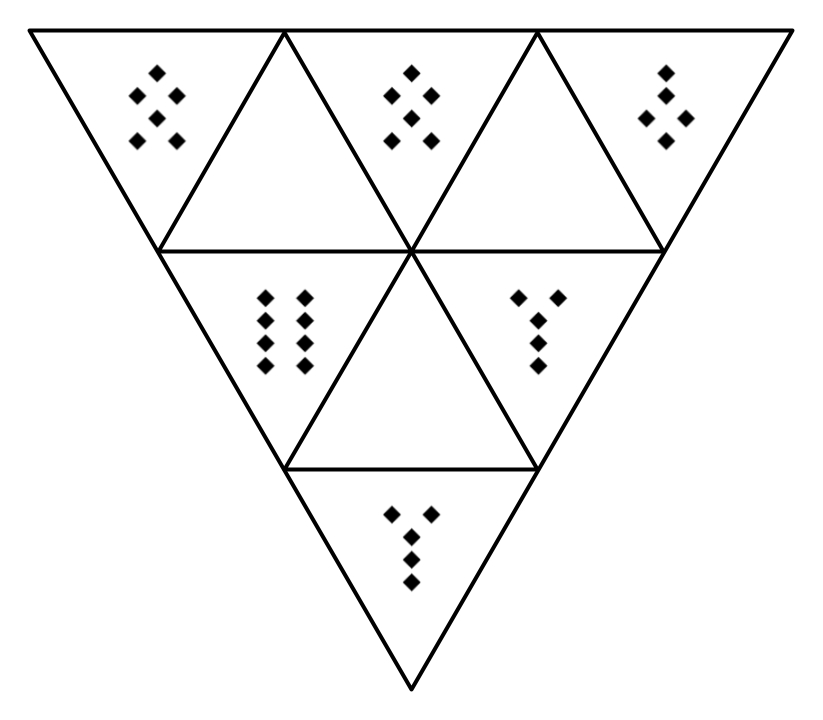
Query: Will X run for President again in 2024?
Outer Triad: Caput Draconis as the Return is a favorable indicator that X will enter the presidential race in 2024. Puer as the Right Condition may be implying that X’s or their supporter’s determination will contribute to their decision to run for office, while Amissio as the Left Condition indicates that the loss of something will also contribute to their decision to run.
Right Triad: Amissio as the Fulcrum is possibly referring to X’s past re-election loss, a defeat which might fuel their aforementioned enthusiasm and eventually help to create an opportunity (Right Process) to renew the campaign.
Left Triad: The past re-election loss indicated by the Fulcrum will influence (or was influenced by) another loss of some kind, as indicated by the Left Condition (Amissio). The compounding effect results in a mass gathering or the mobilization of X’s base as indicated by the Left Process (Populus), an assembly that may also facilitate the renewal of X’s campaign.
Ternion: Puer as the Ternion possibly suggests that the events occurring throughout the chart all share the underlying quality of rashness or pugnacity.
Further Development
The practical divinatory value of the Novenary Chart will likely be ascertained after a number of diverse readings have been conducted. It is also possible that the chart may be better suited to certain types of queries than others, though practitioners may find that techniques similar to those traditionally employed to read the Shield Chart or House Chart might also serve to expand this chart’s capabilities (e.g., via puncti, companies, chart sum, perfection of points, etc.). Suggestions for improving this model, or insights pertaining to its use and development are kindly welcomed and appreciated.
Last Updated: 08-23-2022
Altered featured image by Jr Korpa on Unsplash
